Fundamental Analysis uses key financial concepts to help you accurately perform stock research.

What is Fundamental Analysis
Fundamental analysis is like a master artist painting a vivid picture of an investment. It is just one of many ways to research stocks. Fundamental analysis meticulously examines a company’s financial data and growth prospects to reveal its intrinsic value. Investors employ this art, along with technical analysis, to make informed long-term investment decisions, mitigating risks, and avoiding impulsive choices.

How does technical analysis function? Visualize a company’s profitability as its pulse. A steady, robust rhythm indicates vitality. Similarly, the profit a company makes is a reflection of its financial health, and understanding this is a core part of fundamental scoring strategy. Failing to pay heed to these fundamentals can result in serious financial losses, akin to overlooking health symptoms leading to severe illnesses.
What is Fundamental Analysis?
Fundamental analysis is a method that assesses a stock’s intrinsic value using financial statements, external influences, and industry trends to understand if a stock is a worthwhile investment.
Fundamental analysis includes qualitative and quantitative financial factors like:
- Management
- Interest rates
- Earnings
- Profit margins
Importance of Fundamental Analysis
Why should we consider fundamental analysis as crucial? Picture embarking on a voyage without a map or a clear route. You’re likely to get lost, right? Fundamental analysis is like a compass for investors, guiding them towards stocks that are accurately priced based on their intrinsic value derived from financial capabilities and performance.
Furthermore, understanding a company’s ability to weather economic downturns and project its long-term success is vital for any investor. This understanding is achieved through fundamental analysis, which evaluates economic conditions and market trends.
Key Components of Fundamental Analysis
Envision fundamental analysis as a multi-tiered cake. Each layer represents a different level of analysis that contributes to the overall understanding of a company’s value. The top layer is the economic analysis, the middle layer represents the industry analysis, and the bottom layer is the company analysis.
Together, these layers form the foundation of fundamental analysis. Each layer is crucial in its own right, but it’s the combination of all three that provides a comprehensive understanding of a company’s financial health and future prospects.
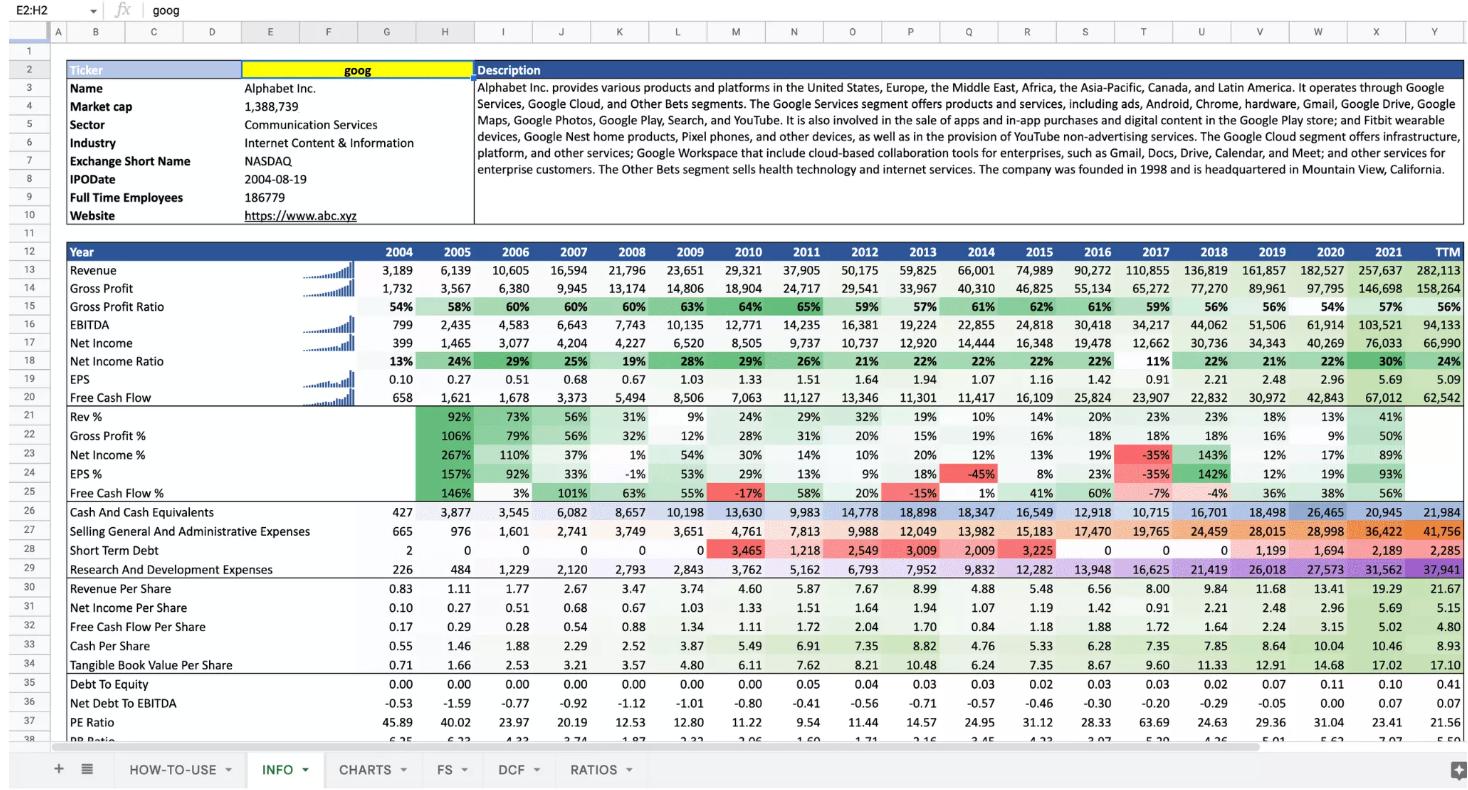
Usually all those measurable characteristics are collected in the form of a powerful excel. Successful investors are eager to share such spreadsheets on the web showing how much data can be captured in a single table (this is not the best way out of the situation and can be replaced by using data-driven tools, but we will say more about this below).
Financial Statements
Financial statements, often referred to as financial reports, serve as the cornerstone of fundamental analysis, which often involves a thorough financial analysis. They provide a detailed snapshot of a company’s financial performance, much like a health report offers insights into a person’s overall well-being.
The income statement, for instance, details a company’s revenues and expenses, serving as a critical barometer of profitability and overall performance. The balance sheet offers insights into how a company is funded and managed by comparing assets, liabilities, and shareholders’ equity at a specific point in time.
Lastly, the cash flow statement provides a comprehensive overview of cash inflows and outflows from operations, investments, and financing, revealing the company’s liquidity and cash management. Just as doctors use a patient’s health report to diagnose ailments, investors use these financial statements to assess a company’s financial health.
Macroeconomic Factors
Macroeconomic factors can be likened to the winds that guide the sails of the financial market. They include GDP growth, inflation rates, and interest rates, all of which significantly impact the broader economic environment and, by extension, investments.
For instance, low interest rates can spur a boom in sectors such as construction, affecting associated stock prices. Similarly, positive economic growth can drive investor confidence and stock prices up, while signs of a recession can lead to a decrease in stock prices.
It’s like the changing winds – investors need to adjust their sails accordingly to navigate the market effectively and maintain their assets’ market value.
Industry Trends and Competitive Landscape
Picture yourself as a sailor steering a ship. You need to understand the ocean currents (industry trends) and the other ships (competitors) in the water. Similarly, industry trends and competitive landscape analysis provide crucial insights into a company’s performance and growth potential. Understanding the industry life cycles, such as growth, maturity, and decline stages, can significantly influence investment decisions and a company’s adaptability. It’s about identifying the currents and adjusting the course accordingly.
Moreover, analyzing a company’s market share can reveal its competitive positioning and its capability in profit generation. It’s like spotting the other ships in the water and determining their speed and direction to avoid collisions and chart the best course.
Qualitative vs. Quantitative Analysis
Fundamental analysis surpasses mere numbers; it encapsulates the narrative those numbers represent. It includes both qualitative and quantitative factors, providing a more comprehensive understanding of a company’s value and potential risks.
Think of qualitative factors as the plot and characters of the story, while quantitative factors represent the page numbers and word count. Both are essential to understand the complete narrative.
Qualitative Analysis
In the story of fundamental analysis, qualitative factors play a crucial role. They represent the less tangible aspects like the quality of management, corporate governance, and business model.
Just like a riveting plot or a compelling character can make a story memorable, strong and experienced leadership, ethical and transparent policies, and a robust business model can significantly impact a company’s future growth potential.
Quantitative Analysis
While qualitative factors constitute the storyline, quantitative factors represent the measurable aspects of the story. They include financial ratios and valuation methods that help determine a company’s financial performance and market valuation.
Just as the number of pages can indicate the length of a book, financial ratios like earnings per share, price-earnings ratio, and return on equity can provide insights into a company’s financial efficiency and investor returns.
Top-Down vs. Bottom-Up Approach
There are two distinct strategies to approach the journey of fundamental analysis: one can either follow a top-down or a bottom-up method. These approaches are like two different paths leading to the same destination.
While the top-down approach starts by analyzing the bigger picture (macroeconomic factors) before zeroing in on specific companies, the bottom-up approach takes the opposite route, beginning with individual company analysis before considering macroeconomic factors.
Top-Down Approach
The top-down approach is like starting a journey by looking at the entire map before deciding on the route. It begins with a focus on broad economic aggregates, basing investment decisions on overall economic conditions.
This approach takes advantage of locating strong sectors that are resilient to international risks, such as sectors benefiting from a robust domestic consumer base. However, while it provides a macro view of investment opportunities, it might overlook profitable individual company investments due to its broader macroeconomic emphasis.
Bottom-Up Approach
On the other hand, the bottom-up approach is like starting a journey by deciding on a specific destination before looking at the broader map. It begins with individual company analysis, focusing on its financial statements, earnings, and revenue growth.
These investors practice value investing by looking for stocks that have the potential to perform well independently of market conditions. They rigorously examine each company’s financial statements and market standing. By employing effective investment strategies, it’s like choosing the path less traveled, potentially leading to hidden treasures.
Step-by-Step Guide to Performing Fundamental Analysis
Having grasped the varied aspects of fundamental analysis, let’s move on to sequentially unmask the process of performing it. This journey includes:
- Gathering data
- Analyzing financial statements
- Evaluating qualitative factors
- Calculating financial ratios.
Think of this process as assembling a puzzle. Each step represents a piece of the puzzle, and when all the pieces come together, you get a complete picture of a company’s financial health and future prospects.
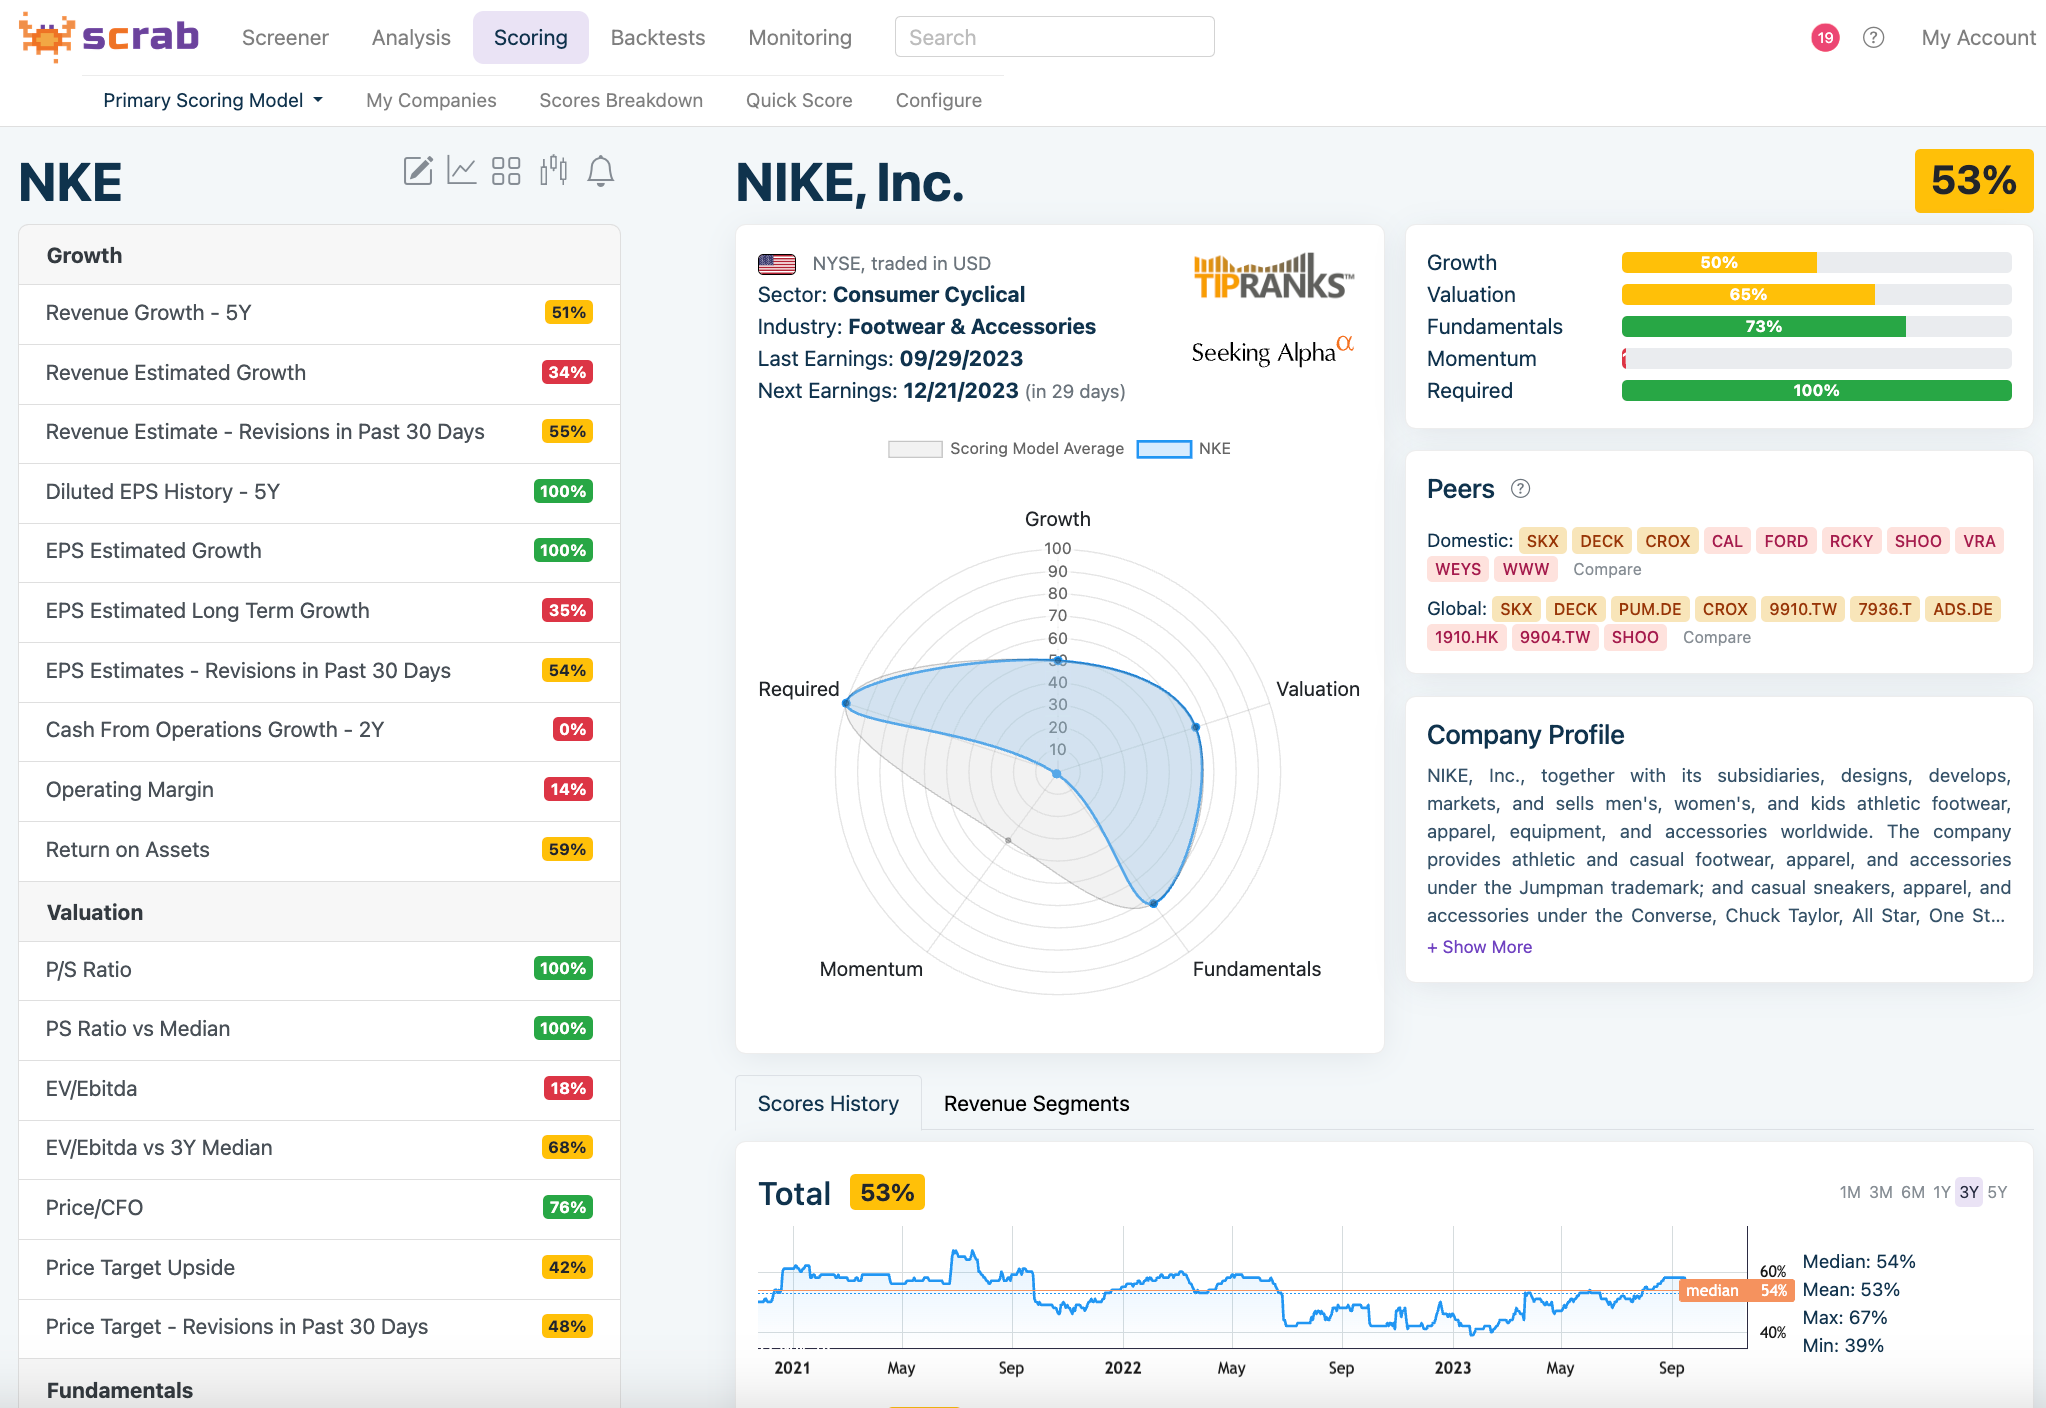
But before we dive deeper into this topic, we have good information for you – these days you no longer have to do the whole fundamental analysis work all manually. There are data-driven tools, such as Scrab.com, that will do this work for you much more accurately, and, importantly, in a bias-free way.
However, in order to properly understand the mechanism of operation of this type of analysis, one must have at least a basic factual knowledge of how such an analysis can be performed. Below you will find a discussion of each of its sub-points.
Gathering Data needed to Perfect Fundamental Analysis
The first step of the journey is gathering data. Just like a treasure hunt, you need to know the right places to look for valuable information. Primary resources include SEC filings, annual reports, and company websites.
Third-party research reports, industry publications, and financial databases offer additional data, allowing analysts to broaden their understanding of a company’s financial status beyond the information provided by the company itself.
Analyzing Financial Statements
After gathering the data, the next step is analyzing the financial statements. This process is akin to a doctor diagnosing a patient’s health condition based on medical reports. Methods like horizontal analysis, vertical analysis, and common-size analysis are used to compare financial data over multiple periods, assess the company’s operations, and identify trends.
By analyzing the balance sheet, income statement, and cash flow statement, investors can assess a company’s financial position, performance, and solvency, providing insights into its financial health.
Evaluating Qualitative Factors
Evaluating qualitative factors is like understanding the plot and characters of the story. It includes examining the strategic vision, operational effectiveness, and the track record of the leadership team.
Assessment of qualitative factors involves identifying non-numeric aspects such as customer satisfaction and technology ownership that affect the company’s value and determining their significance.
Calculating Financial Ratios
The last piece of the puzzle is calculating financial ratios. Financial ratios, like earnings per share, price-earnings ratio, and return on equity, are vital indicators of a company’s financial performance and are calculated using data from financial statements.
Common Mistakes
Like any journey, fundamental analysis also comes with a set of common errors and pitfalls to sidestep. Impatience and expecting rapid growth can lead to emotional decisions based on fear and greed, which undermines long-term success.

Additionally, a lack of diversification in investments may increase risks and cause greater volatility in an investor’s portfolio. While numbers are important, solely relying on quantitative analysis may lead to a blind spot in investment analysis.
The Bottom Line
By employing the tools of fundamental analysis, namely financial statements, macroeconomic factors, and qualitative and quantitative factors, investors can navigate the financial market with confidence, making informed long-term investment decisions.